Yield curves are an essential tool for bond investors, serving as a roadmap that illustrates the relationship between interest rates and the maturity dates of debt securities. Understanding yield curves can significantly impact investment strategies and risk management, allowing investors to make informed decisions in an ever-changing market. This article will delve into the intricacies of yield curves, their implications for bond pricing, and practical strategies for leveraging them effectively.
Understanding Yield Curves
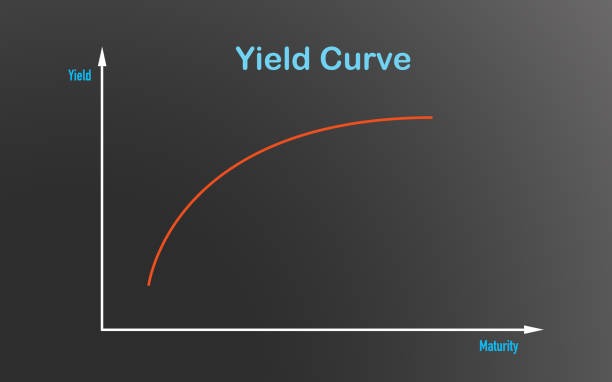
At its core, a yield curve is a graphical representation of the interest rates on bonds of different maturities, typically government bonds. The x-axis represents the time to maturity, while the y-axis displays the yield or interest rate. The shape of the yield curve can provide valuable insights into the market’s expectations regarding future interest rates and economic conditions.
There are three primary types of yield curves. The normal yield curve slopes upward, indicating that longer-term bonds have higher yields than shorter-term bonds. This shape suggests that investors expect stronger economic growth and potential inflation over time, warranting higher returns for longer commitments.
In contrast, an inverted yield curve occurs when short-term interest rates exceed long-term rates, signalling potential economic downturns. This phenomenon often reflects market fears of recession, as investors seek safety in long-term bonds, driving down their yields. A flat yield curve indicates uncertainty in the market, where short- and long-term rates converge, suggesting that investors are unsure about future economic conditions. Check out this weblink for more information.
Interpreting Yield Curves
Interpreting the shape of the yield curve can reveal critical information about market expectations and investor sentiment. A normal yield curve usually reflects confidence in the economy, where investors are willing to take on longer-term investments for higher returns. This pattern may suggest strong growth prospects and an expectation of rising interest rates in the future.
On the other hand, an inverted yield curve often serves as a warning sign of an impending recession. Historically, inverted yield curves have preceded economic downturns, as seen in past instances like the 2008 financial crisis. In these scenarios, short-term rates exceed long-term rates, indicating that investors expect economic stagnation or contraction.
A flat yield curve, which can indicate uncertainty in the market, arises when investors are unsure about the direction of interest rates or the economy. This ambiguity often leads to cautious investment behaviour, with investors holding back on long-term commitments.
Yield Curves and Bond Pricing
The relationship between yield curves and bond prices is crucial for bond investors. As interest rates rise, the prices of existing bonds typically fall. This inverse relationship is primarily due to the fixed coupon payments of existing bonds, which become less attractive when new bonds offer higher yields. Therefore, analysing yield curves helps investors understand how interest rate movements will impact their bond portfolios.
Duration, a measure of a bond’s sensitivity to interest rate changes, also plays a significant role in this relationship. Bonds with longer durations are generally more sensitive to interest rate fluctuations than those with shorter durations. This sensitivity can lead to significant price volatility, making it essential for investors to consider duration alongside yield curve analysis.
Yield curve shifts can have varying impacts on different types of bonds. For example, government bonds, often seen as safer investments, may react differently to yield curve changes compared to corporate bonds, which carry higher risk. High-yield bonds, or junk bonds, are particularly sensitive to yield curve movements, as they often rely on investor sentiment regarding economic conditions and default risk.
Strategies for Bond Investors
Yield curves can serve as a valuable tool for bond investors seeking to optimise their investment strategies. One approach involves identifying potential buying and selling opportunities based on the yield curve’s shape. For instance, when the yield curve is steep, investors may consider investing in long-term bonds to capitalise on higher yields. Conversely, during an inverted yield curve scenario, short-term bonds may offer more security and less exposure to potential losses.
Timing the market based on yield curve analysis can also be advantageous. Investors can adjust their bond portfolios in anticipation of yield curve movements, thereby maximising returns or minimising losses. For example, if an investor predicts that interest rates will rise, they might consider reducing exposure to long-term bonds and shifting toward short-term investments.
Portfolio diversification is another crucial strategy based on yield curve insights. By balancing short-term and long-term bonds, investors can mitigate risks associated with yield curve fluctuations. This diversification allows investors to capture opportunities across different segments of the bond market while reducing their overall exposure to interest rate risks.
Conclusion
In conclusion, understanding and analysing yield curves is fundamental for bond investors aiming to navigate the complexities of the fixed-income market. By interpreting yield curve shapes, recognizing their implications for bond pricing, and leveraging this knowledge to inform investment strategies, investors can position themselves for success in various market conditions. Continuous monitoring and analysis of yield curves will empower investors to make well-informed decisions, ultimately enhancing their bond investment outcomes.


